Press Release
HKU Ecologist Discovers that Changes in Global Biodiversity Pattern Are Driven by Temperature and Climate
28 Jun 2012
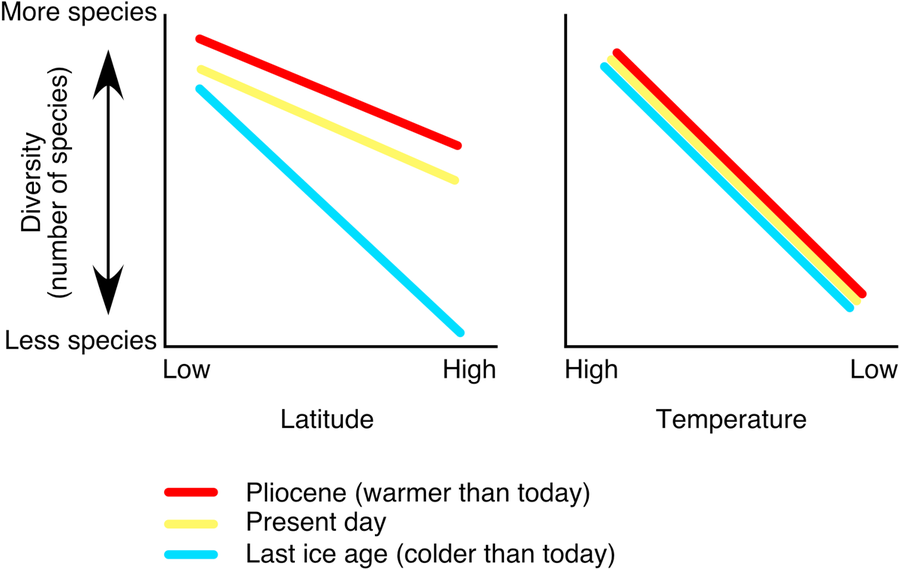
Figure 1 is a simplified graph to explain latitude-biodiversity (left) and temperature-biodiversity (right) relationships. Note large differences of the latitudinal diversity patterns
among the three time slices of present day (orange), last ice age (18,000 years ago, a period colder than today: blue), and 3 million years ago (Pliocene, a period warmer than
today: green), and remarkable similarity of the temperature-diversity patterns. Temperature-diversity lines of three time slices are almost completely overlapped, suggesting
strong and constant temperature control of biodiversity.
Image
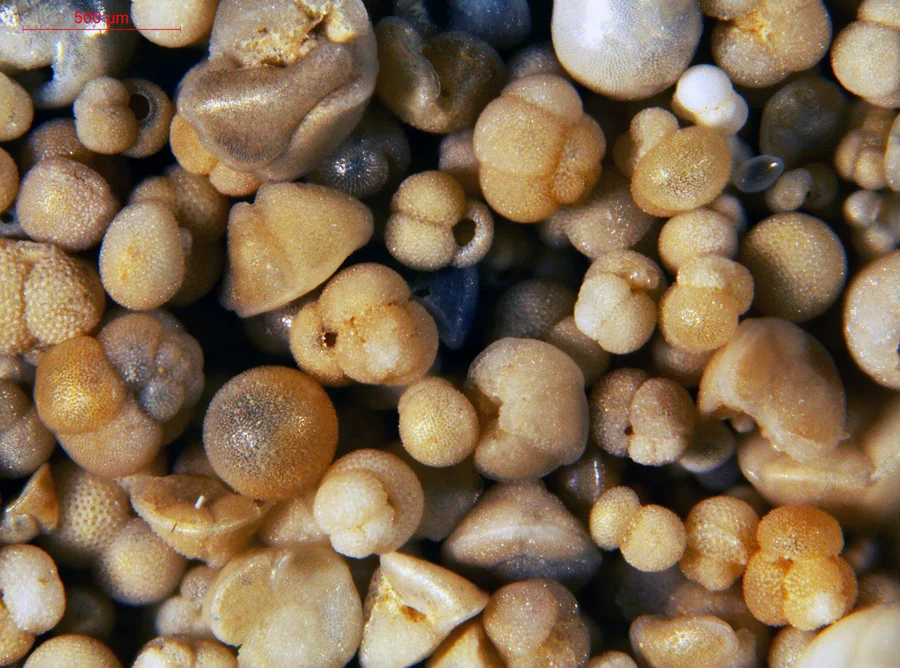
Image 1: This image shows deep-sea sediment including numerous fossil zooplankton (Foraminifera).
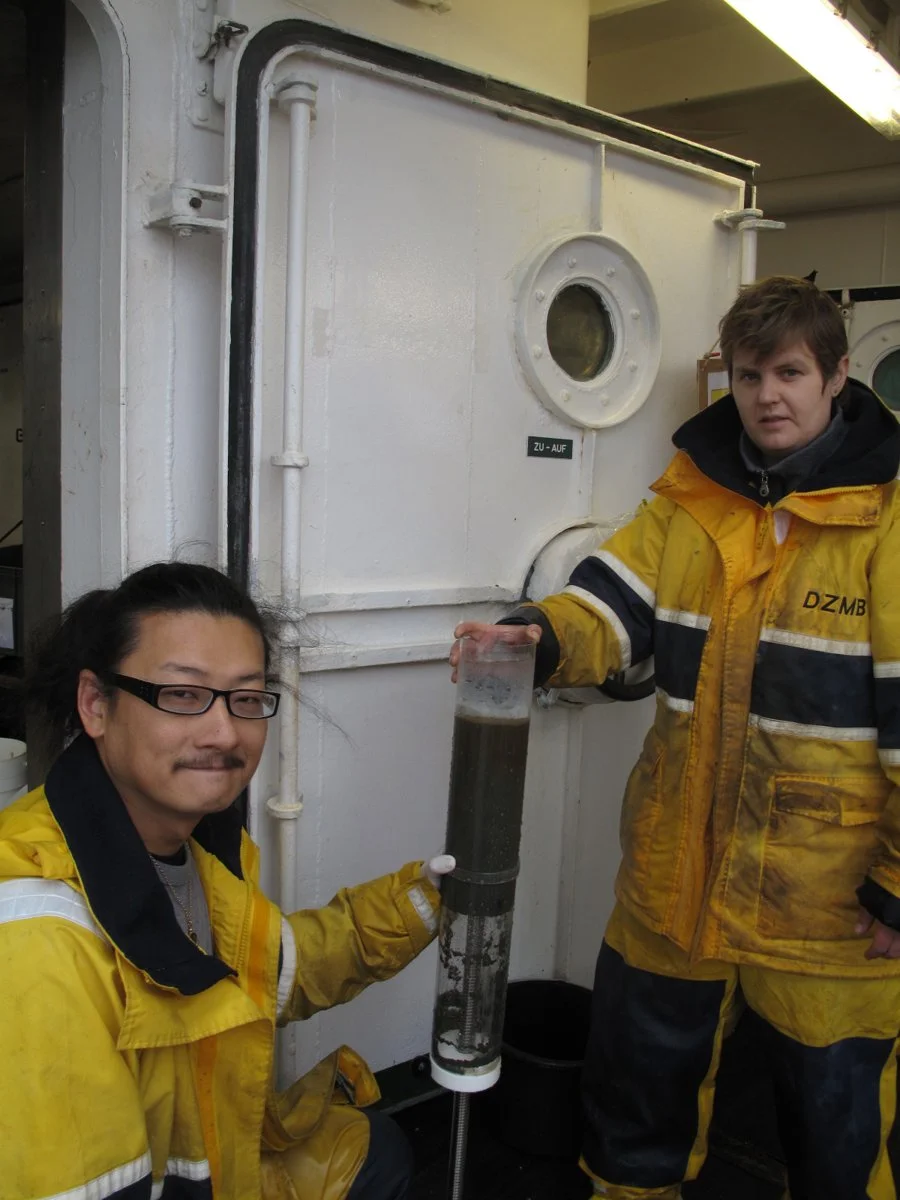
Image 2: Dr Moriaki Yasuhara (left) and a research colleague studying a core of
sediment sampled from the deep sea.
sediment sampled from the deep sea.